


IoT environment sensor with Raspberry Pi Python Code
In this tutorial, John Lawrence will show you how to make an IoT environment sensor with Raspberry Pi, run by python code.
Hardwares:
- Raspberry Pi 4
- Raspberry Pi Qwiic hat
- Zio Qwiic SHT31 temperature and humidity sensor
- Zio Qwiic TSL2561 light sensor
- Zio Qwiic PM sensor kit
- Some Qwiic Cable
Step 1 Setup the Raspberry Pi
Check out this super quick video on how to setup the Raspberry Pi.
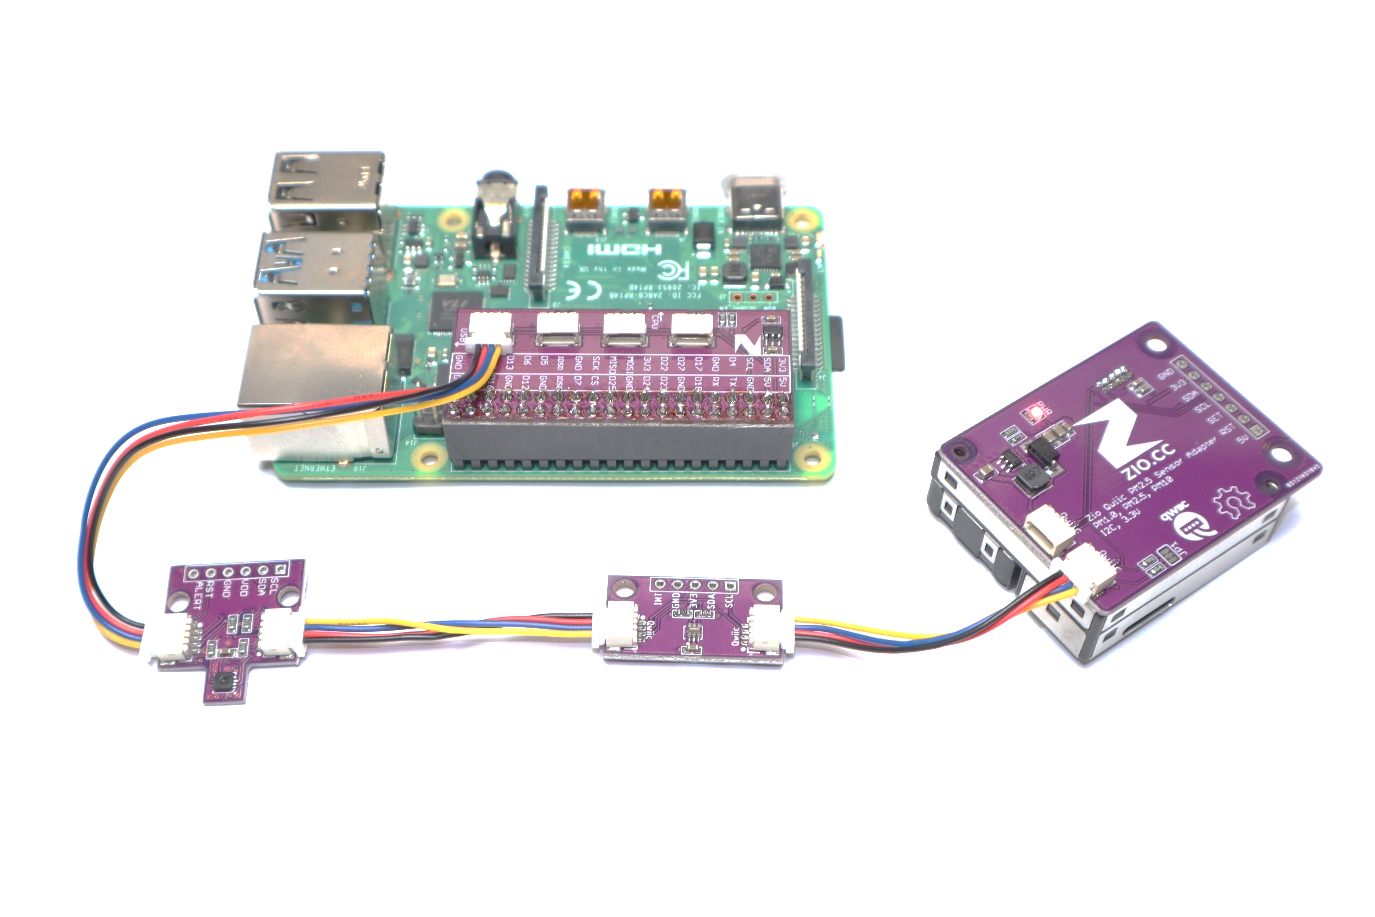
Step 2 Connect
Connect the ZIO SHT31 Temperature and Humidity sensor, the ZIO TSL2561 Light sensor and the ZIO Particulate Matter Sensor to the Raspberry Pi via the ZIO QWIIC HAT.
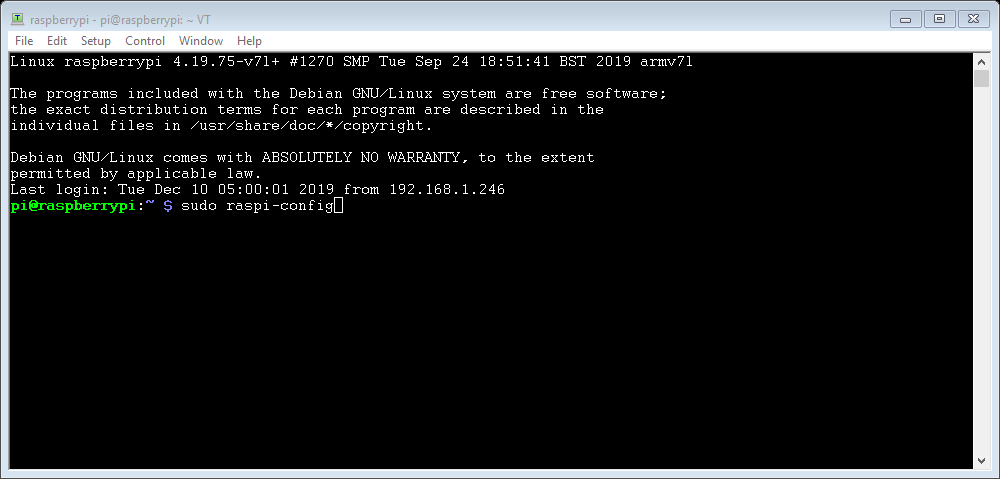
Step 3 enable the I2C bus
Either from the Raspberry Pi’s desktop or via SSH, Open the terminal and type in:
sudo raspi-config and press enter.
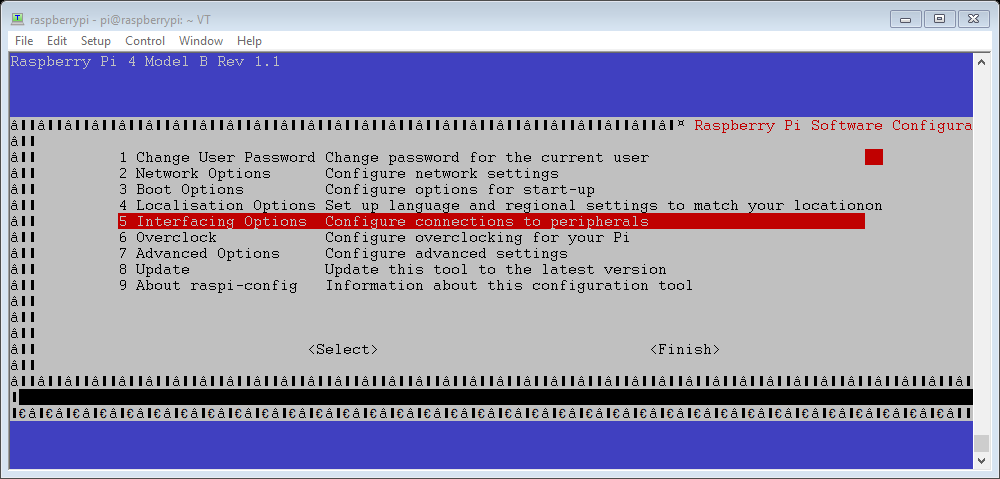
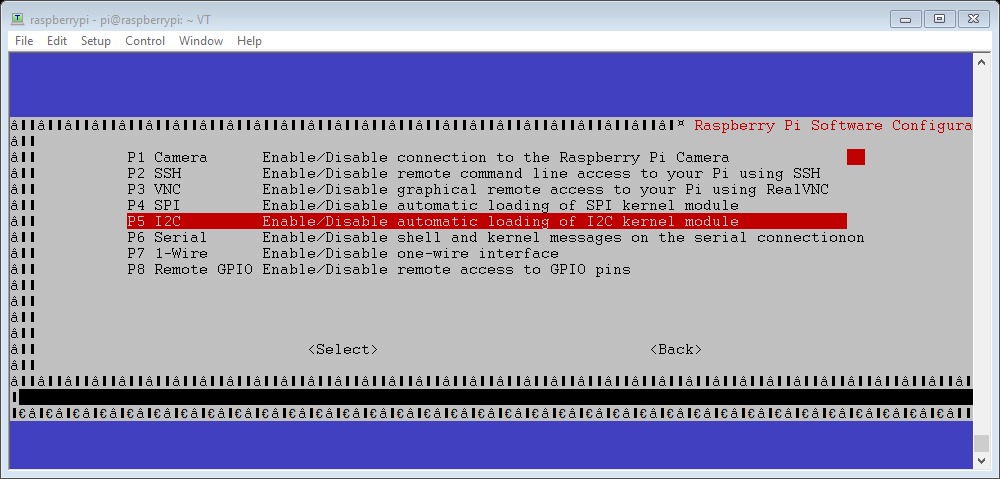
Using your keyboards arrow keys, select ‘5 Interfacing Options’ and press enter.
Scroll down to ‘P5 I2C’ and press enter.
Then select ‘<Yes>’ and press enter to enable the I2C interface for the ZIO QWIIC ecosystem.
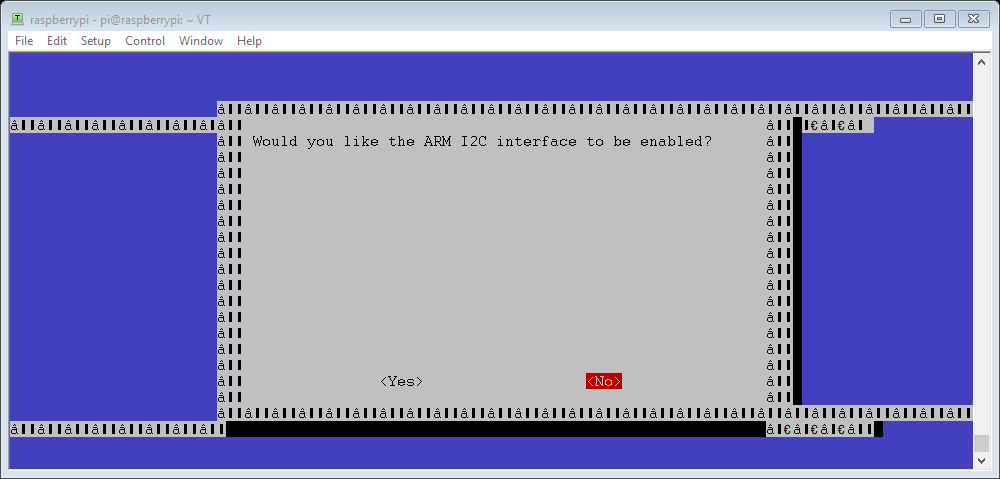
Select ‘<Ok>’ and ‘<Finish>’ to return to the terminal.
Step 4 Download python script
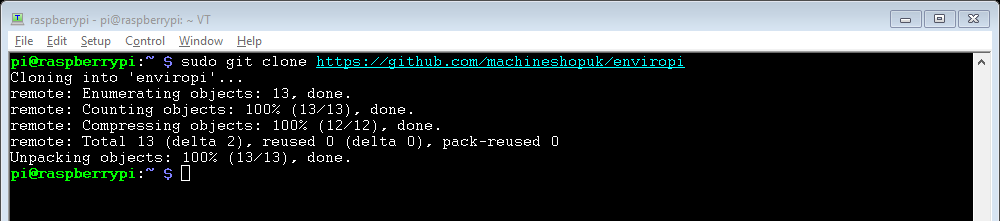
Whilst still in the terminal type:
sudo git clone https://github.com/machineshopuk/enviropi
Step 4 Install Plotly
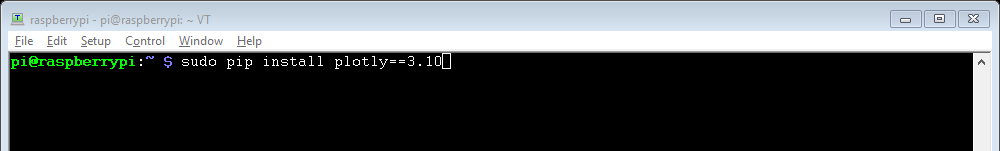
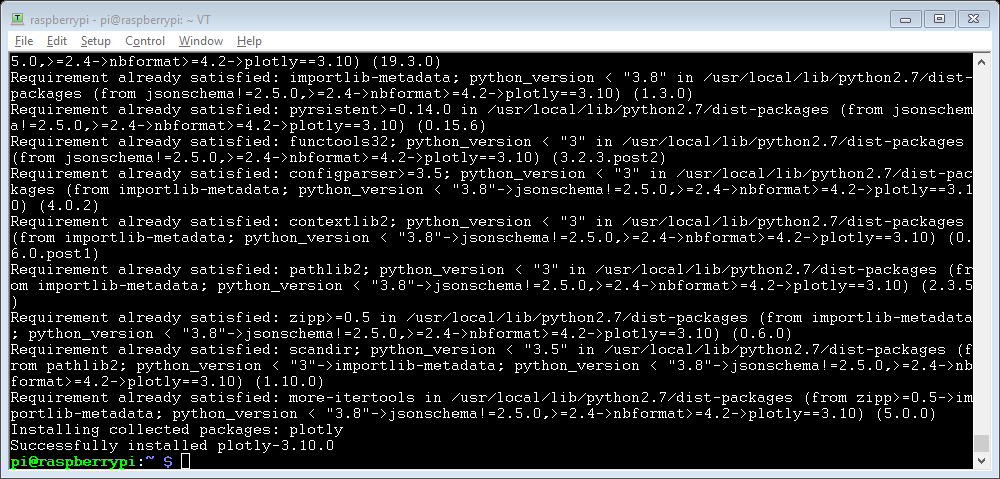
We need to install the Plotly library to utilise the functions to communicate with the plotly servers. Simply use this command to install it. This will also install any necessary support files.
sudo pip install plotly==3.10
Step 5 Generate Plotly API details
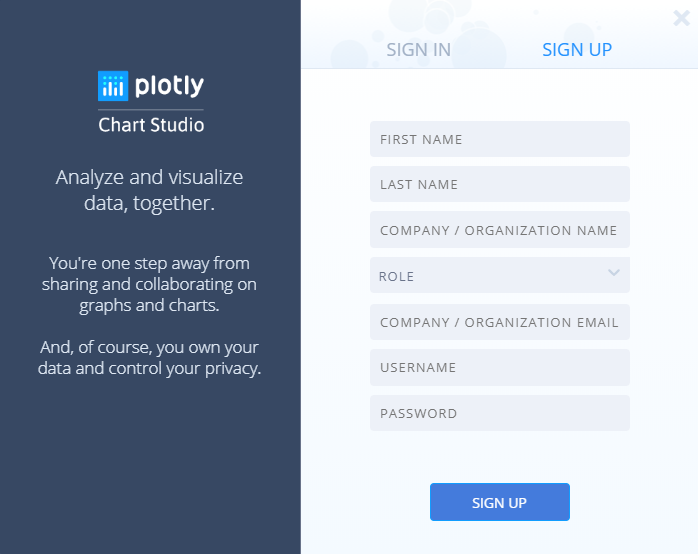
Create a Plotly account by clicking on Signup at https://chart-studio.plot.ly and entering your desired login details.

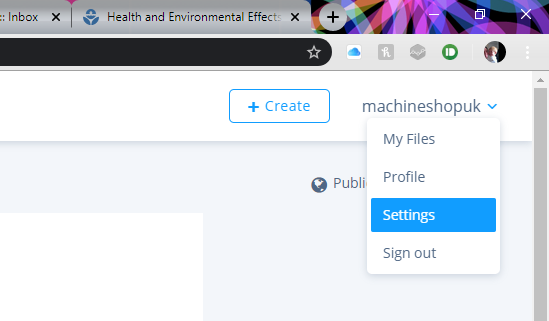
Once you have your account setup, hover over your username and click on settings.
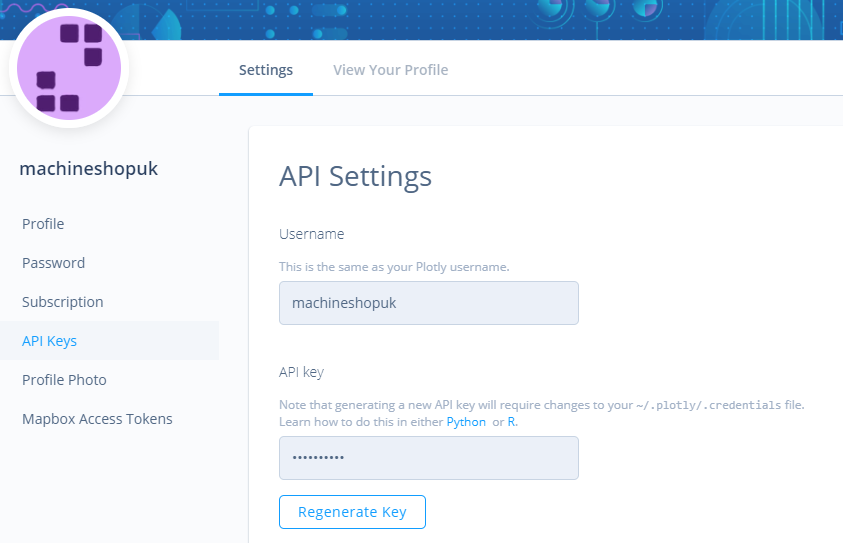
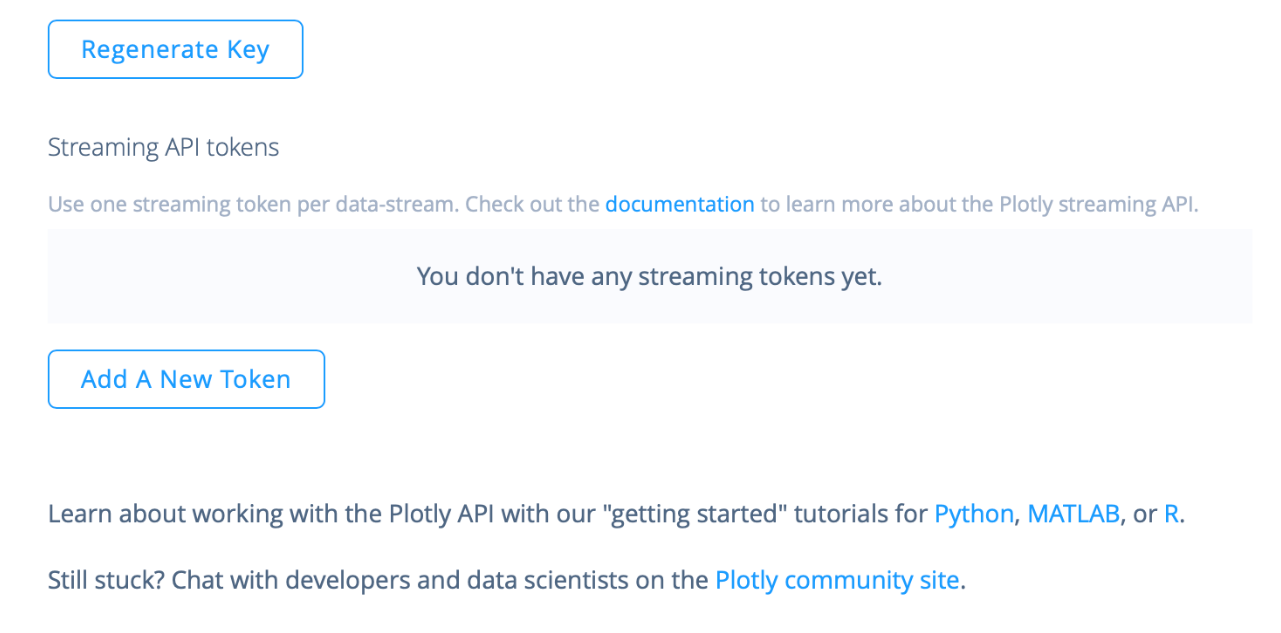
Click on API Keys and click Regenerate Key, it will ask for your account password. This will create a long string of lower and uppercase letters and numbers. Copy this into a text file, we are going to need this in a minute.
We are also going to need several streaming tokens, one for each data set. In this tutorial we have Temperature, Humidity, Light, PM1.0, PM2.5 and PM10.0, so we will need 6 streaming tokens. Click Add A New Token 6 times to generate all of the key and note them down with you API Key you generated above as we will need to enter them into our python script.
Step 6 Edit Python script
Before we run the script, we need to enter the Plotly API details we collected in Step 5.
At the command prompt, enter the enviropi folder and open the python script.
cd enviropi
sudo nano enviropi.py
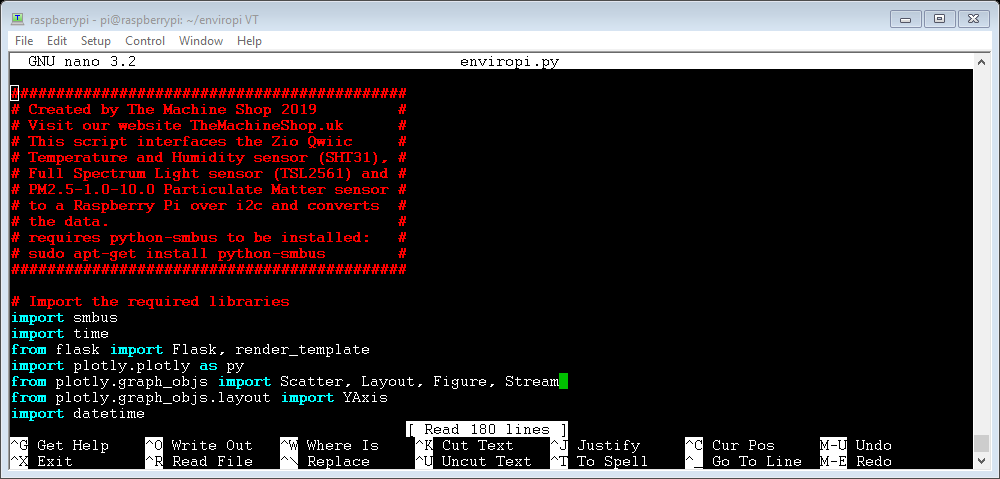
Scroll down to the API settings section of the code and enter your API username and keys from step 5 in between the ‘quotes’ and replacing the ### symbols.
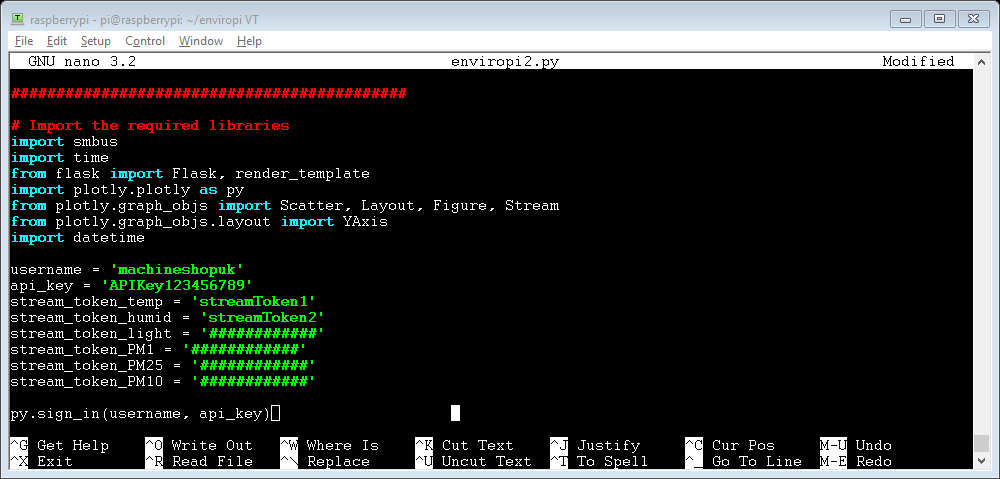
Now save the script and exit from nano by pressing CTRL + X and when prompted ‘Save modified buffer?’ press Y
Step 7 Run the Script
Then run the script by typing:
sudo python enviropi.py
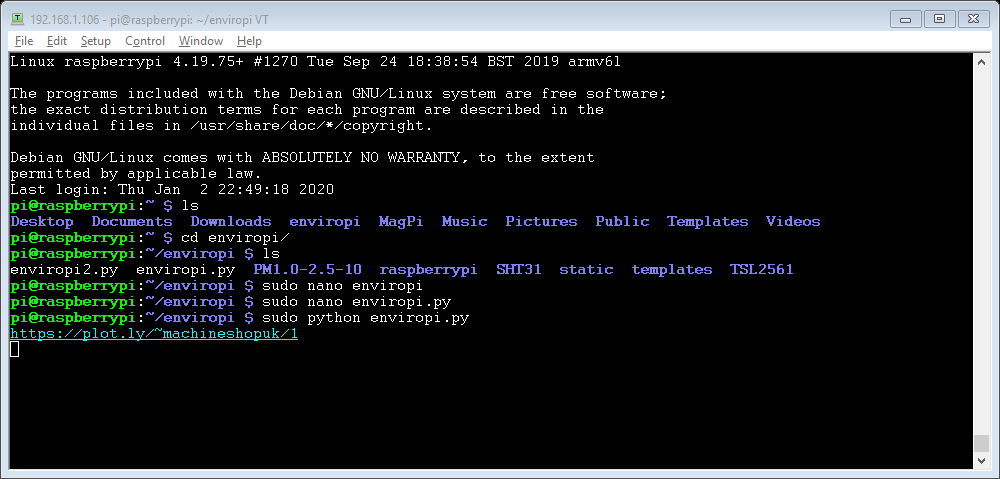
If you have entered all of your details correctly, then it should output a link to view the data on the Plotly website. If will start off with a graph with just one data point then after 30 seconds, another data point will be submitted and it will draw a line between the two points. As the graph fills up, it will automatically scale to show all of the data. This graph is configured to show a maximum of 10,000 data points with an interval of 30 seconds giving a total duration of 3.47 days’ worth of data.
The graph below is an example of the output it will achieve. We had it setup in the office monitoring the environment. The blue and orange flat lines are the temperature and humidity which no surprise, didn’t change much. The green line is the light intensity. This shows that the light was switched off at about 15:55 and switched back on again at 16:36. The red, purple and brown lines are from the ZIO Particulate Matter sensor. We had the soldering irons switched on whilst we were monitoring the environment and we can see that particulates in the air dramatically increased at 15:30 up until 15:55 when the soldering stopped and the person left the office, switching off the light as they left. The particulates in the air slowly decreased so I’m guessing the office door was shut and at 16:36 when they came back they left the door open which quickly brought in fresh air. It looks like they started soldering again at 16:45 until 17:45 and then they opened the door but left the light on.
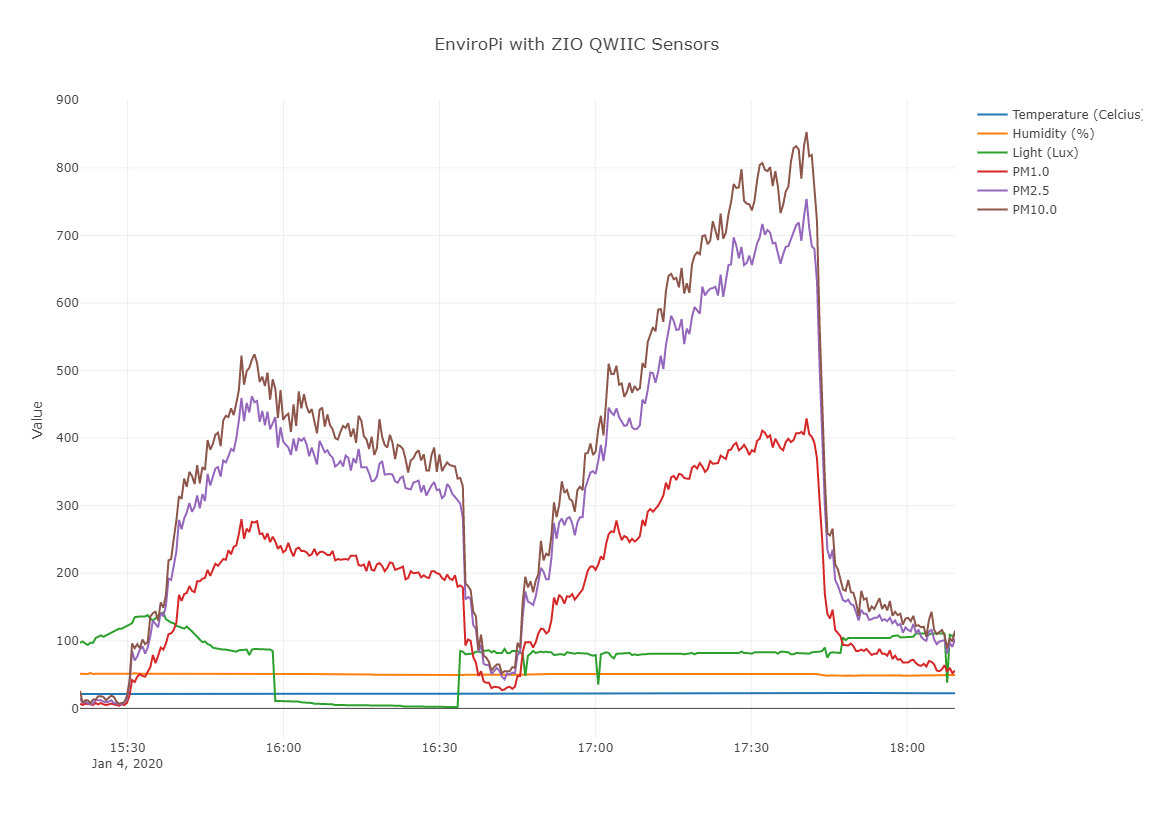
This data is extremally valuable and has given us an insight into the environment we work in. We can see that the temperature and humidity is nice and stable and that perhaps the light levels need to be slightly increased to ensure people can see what they are doing. The alarming data is from the particulate matter sensor and obviously shows that our extraction system needs to be improved. We could even use the data from the sensor to automatically activate the extraction system if the particulates in the air get too high. This would ensure that everyone in the office is working in clean air just in case someone who is soldering has forgotten to turn the extractor on. I know I’ve done that in the past far too many times!